Description
A momentum-based reversal system built on the Commodity Channel Index (CCI).
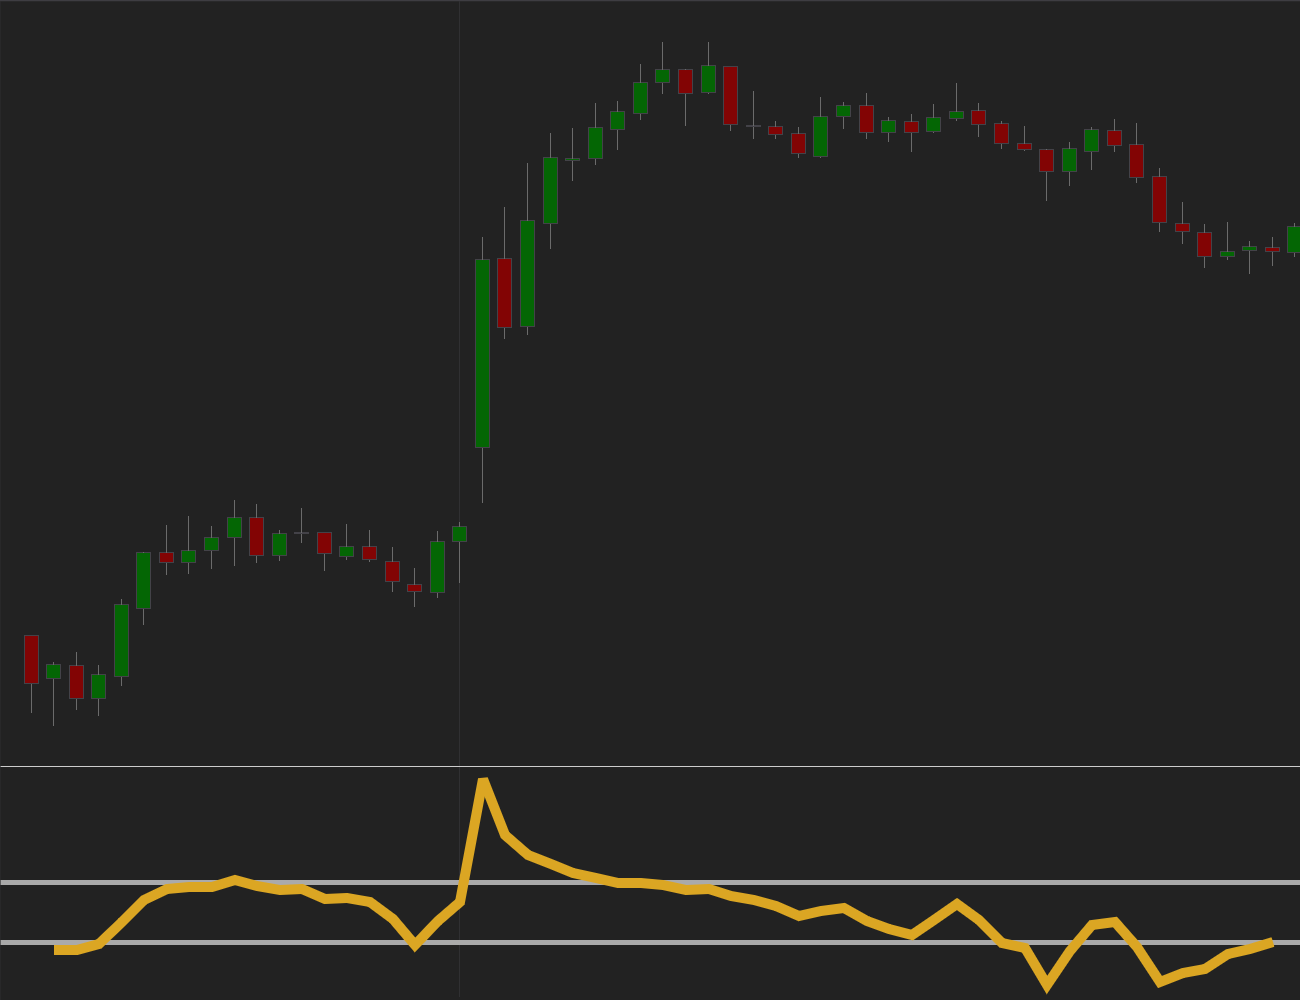
The strategy identifies potential turning points by detecting when price momentum becomes stretched relative to its recent average. High positive CCI values can signal overbought conditions and potential short setups, while deeply negative values may indicate oversold conditions and long opportunities.
All CCI parameters and threshold levels are fully configurable, allowing you to fine-tune sensitivity and signal frequency across different markets and timeframes.
How to use
On the first use, paste you license code into the License field in strategy parameters.
- Set the CCI Period – this defines how responsive the indicator is.
- Choose your Overbought and Oversold thresholds to define reversal zones.
- Choose the entry mode (Limit or Market) and configure your preferred risk settings.
- Enable optional modules such as profit targets, stop losses, plots, or color settings.
- Run backtests or live trading – the strategy executes and manages trades automatically.
Indicator Parameters
| Parameter | Description |
|---|---|
| Period | Controls indicator sensitivity. Smaller values = faster signals, more noise. Larger values = smoother behavior. |
| Overbought Level | Threshold above which the strategy considers short setups. |
| Oversold Level | Threshold below which the strategy considers long setups. |
Trading Parameters
| Parameter | Description |
|---|---|
| Trading | Entry Type | Market = fastest execution. Limit = controlled entry at your price. |
| Trading | Profit Target | Locks in gains at your chosen distance. Optional. Supports Limit and MarketIfTouched. |
| Trading | Stop Loss | Manages downside risk. Optional. Stop – standard exit. Simulated-StopLoss – helps avoid poor fills in thin markets. |
| Additional | Show or hide MA lines on the chart, fully customizable for clean visual workflow. |